November 2018
Pulsars are fast rotating (up to ~1000 rotations per second) and strongly magnetised (magnetic field intensities are trillion times that of the Earth) neutron stars.These compact objects (~1.4 solar masses, but a radius of only ~10 km) stand among the most powerful accelerators in the Universe and as such provide precious laboratories, both for astrophysics and fundamental physics. Pulsars were first detected in radio waves, but many are also detected in X-rays and gamma-rays. Roughly 10% among the ~2600 known pulsars are gamma-ray emitters.
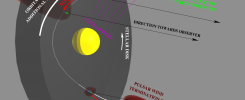
The most popular scheme for explaining the periodic nature of the radio signals emitted by pulsars is inspired by the mechanism at work in a lighthouse. The intense magnetic field results in an anisotropic emission, resembling the beam of a light house, which rotates due to the tilt between the rotation axis and the magnetic dipole axis of the pulsar. When the direction of the emitted beam crosses the line of sight of an observer, a pulsation is detected at the pulsar rotation period (see an animation here).
A similar scheme can also lead to or X-ray or gamma-ray pulsations. However, an alternative possibility is also being studied, called the striped-wind model. In this view, the acceleration of particles and the emission take place in the (vicinity of the) equatorial plane of the pulsar wind, beyond the so-called “Light Cylinder” radius (see below). The beaming and the pulsating nature of the signal result from relativistic effects in the wind which can reach ultra-relativistic speeds.
The pulsar named PSR B0833-45 in the Vela constellation (the Vela pulsar) is not less than the brightest pulsar in radio waves and in gamma-rays of a few GeV. It lies at a relatively short distance of roughly 1000 Light Years (or ~280 pc). The Vela pulsar was discovered using the Molongo Radio telescope in 1968 [1] by Large, Vaughan & Mills, shortly after the discovery of the very first pulsar, CP1919+21 [2]. The association of PSR B0833-45 with the extended radio nebula, Vela-X [1], and hence with the shell-type Vela Supernova Remnant (SNR) which surrounds the X-ray nebula, was one of the very early and direct proofs that neutron stars are formed at Type II SN explosions, and that their spin-down energy is fuelling the non-thermal nebulae.
Observations spanning over a large part of the electromagnetic spectrum have revealed that the pulsar is surrounded by multiple nebulae nesting as Russian dolls: a very compact X-ray nebula is itself is contained in a larger one seen both in X-rays (Vela-X, called the cocoon because of its morphology) and in VHE gamma rays, all of which are contained in a larger nebula seen again in VHE gamma rays (see here for a dedicated page on the Vela-X wind nebula seen with H.E.S.S.) and radio.
The first indication for gamma-ray pulsations from Vela was obtained in 1974 at energies <100 MeV [3] before its firm detection by the SAS-2 satellite in 1975 [4]. It has since been detected in the GeV range with all subsequent space-borne gamma-ray instruments, namely, COS B [5], EGRET [6], AGILE [7], and Fermi-LAT [8].
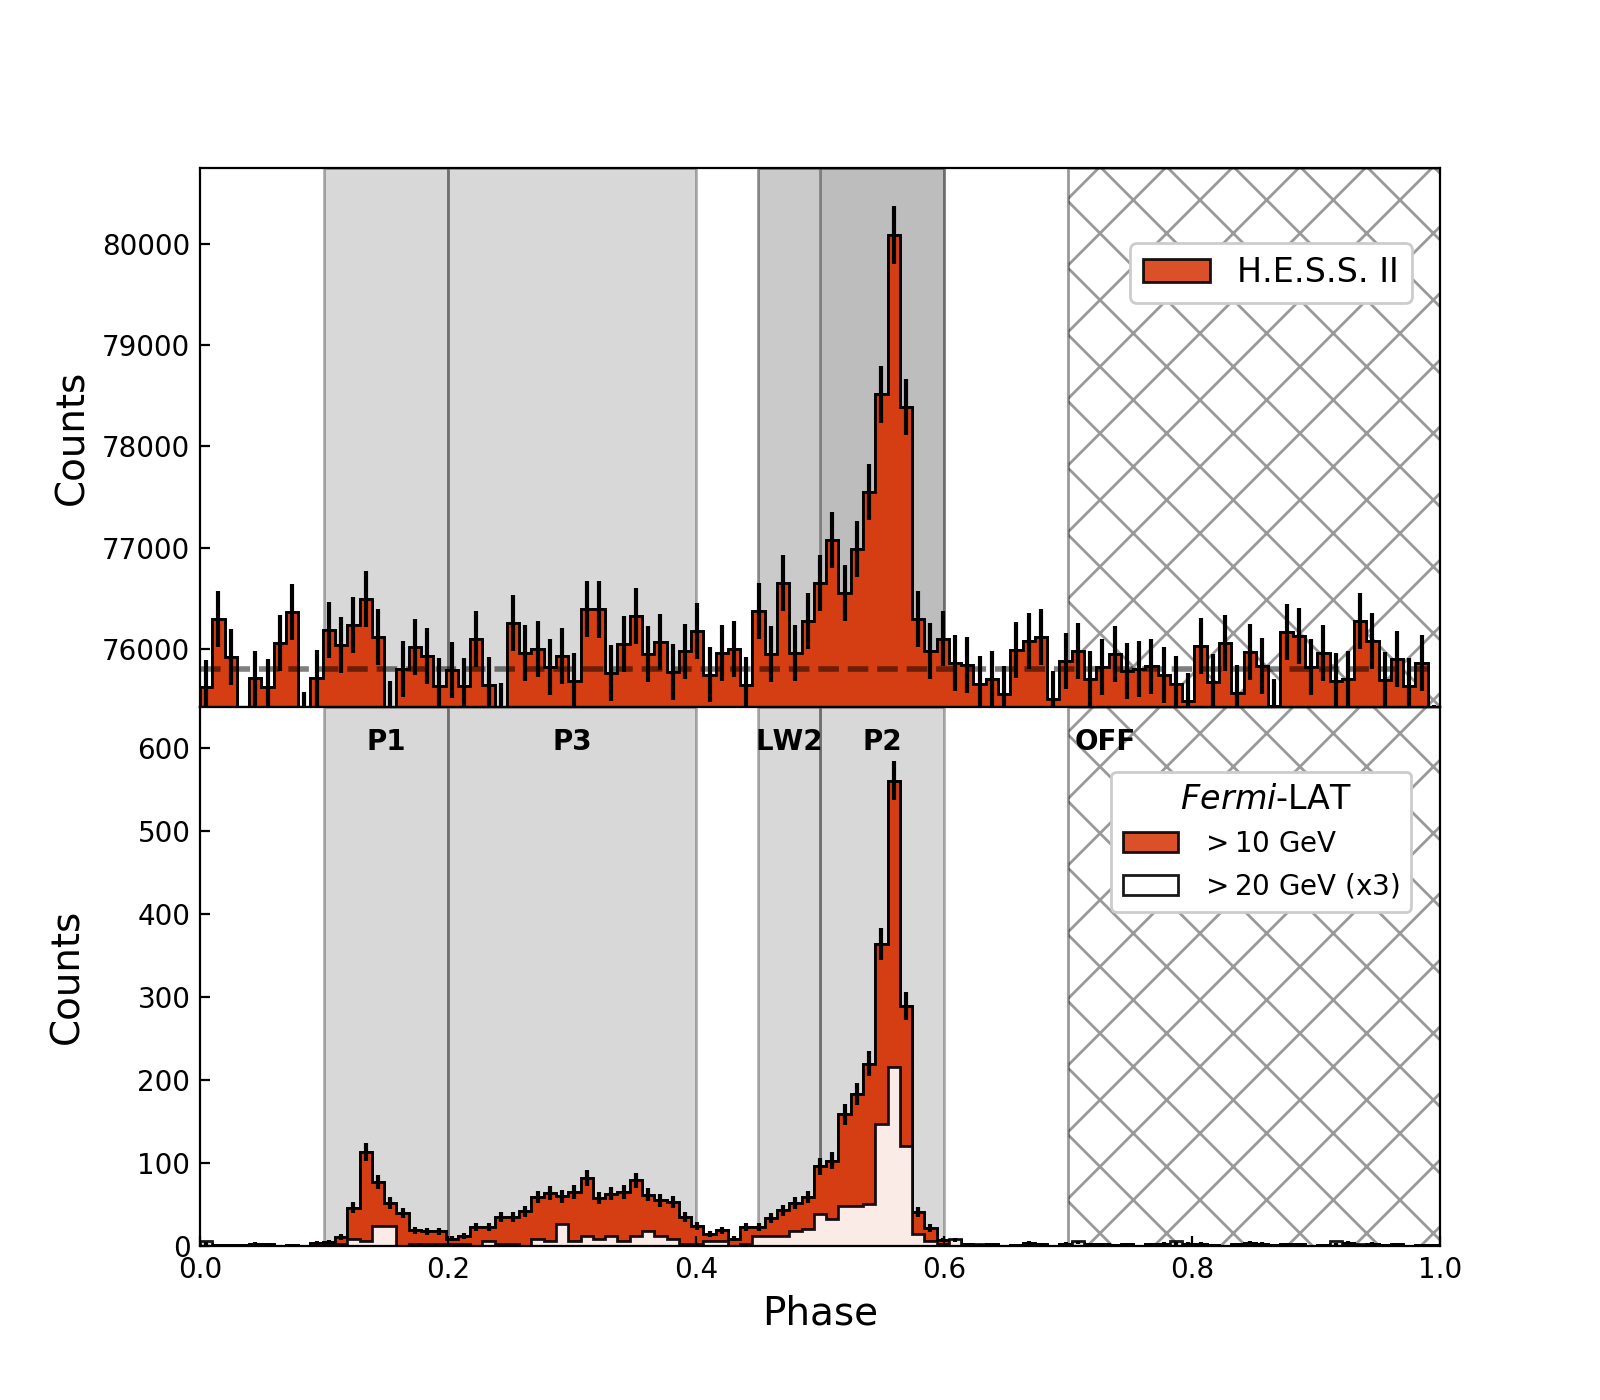
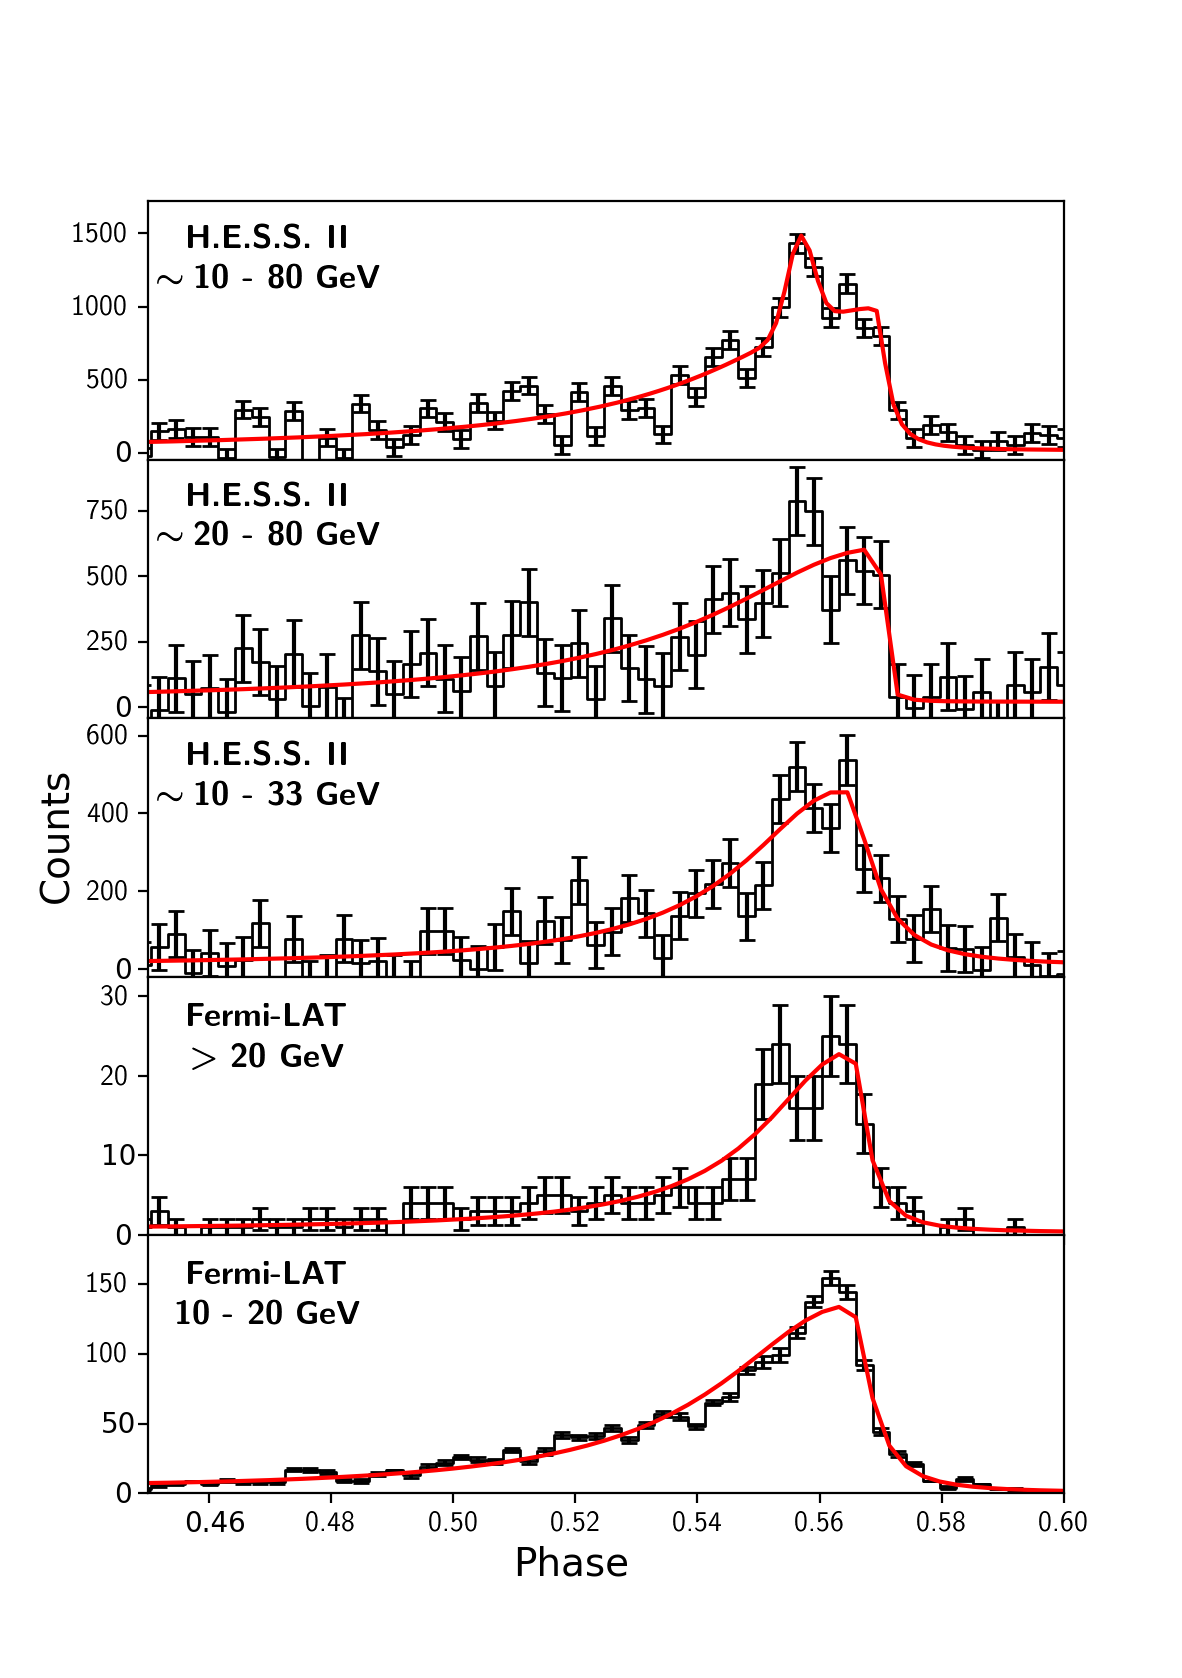
At a period of 89 ms, the gamma-ray light curve of the Vela pulsar exhibits two peaks, labelled P1 and P2, separated by 0.43 in phase and connected by a bridge emission, labelled P3 (see Fig. 1).
Previous observations of the Vela pulsar with the H.E.S.S. array, above a threshold energy of 170 GeV, had only resulted in upper limits [9]. Before the observations reported here, the highest energy gamma-ray pulsations from the Vela pulsar were detected with the Fermi-LAT: based on 11 months of exposure, a high significance signal was obtained up to 20 GeV from the pulse P2 [10], while the exploration of a deeper observation data set of 62 months of observations showed that the pulsations extend above 50 GeV with a weak total signal of five photons at a 4σ significance level [11].
As the brightest persistent source of high-energy gamma-rays in the GeV sky with a potential signal in the tens of GeV range, the Vela pulsar was one of the prime targets in the commissioning period of the 2012 upgrade of the H.E.S.S. array. This upgrade referred to as H.E.S.S. II (see here), consisted of the addition of a 28 m equivalent diameter telescope (CT5) to its core array of four 12 m equivalent diameter telescopes (CT1-4) and was designed to push the energy threshold of the system to below 50 GeV (from above 100 GeV), thus bridging the gap with satellite-based gamma-ray instruments.
Observations and Results
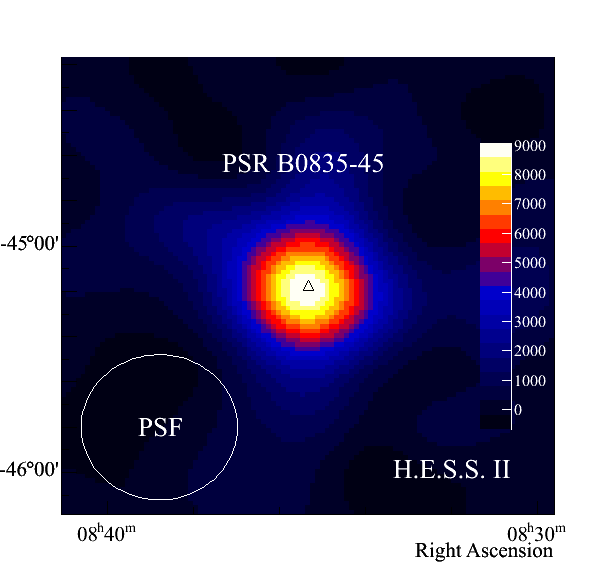
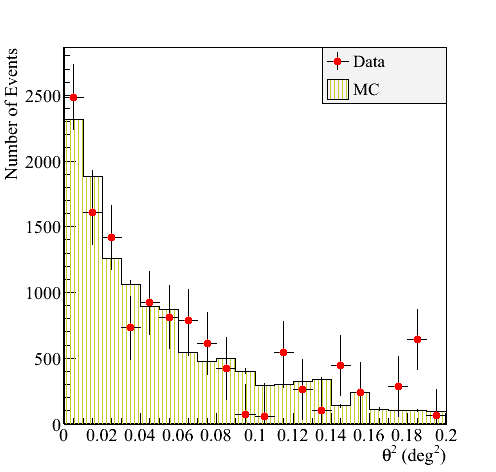
Data from 40.3 h of observations made between 2013 and 2015 with the fifth telescope (CT5) were analysed in monoscopic mode. A reconstruction pipeline specifically designed to achieve a large effective area at the lowest energies possible was used and resulted in the detection of a gamma-ray pulsed signal at a high significance level (>15σ) from the P2 peak of the Vela pulsar (see Fig. 1) [12][13].
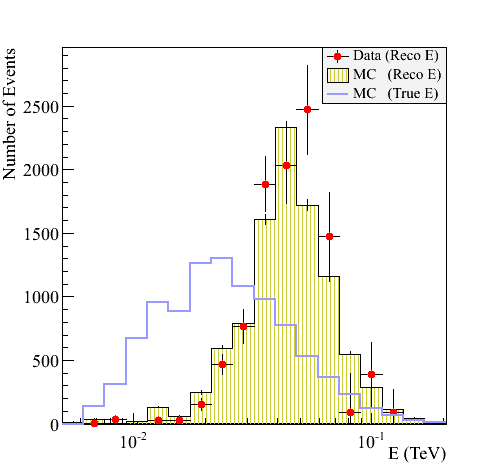
In parallel, we used results we obtained from eight years of Fermi-LAT observations below 100 GeV [13] as input to Monte Carlo simulations of the CT5 telescope to produce the expected signal in CT5 which was then compared to the measurements. An excellent agreement was obtained which validated the response model and the analysis pipeline of CT5 down to energies of ~10 GeV: we were indeed able to demonstrate that of a total of 15835 events, more than 6000 detected with CT5 lie at an energy below 20 GeV (see Fig. 2).
Evolution of the phasogram with energy
While H.E.S.S. II data below 33 GeV confirm the evolution with energy of the light curve, at higher energies, CT5 data shows a change in the pulse morphology of P2, i.e. an extreme sharpening of its trailing edge, together with the possible onset of a new component at 3.4σ significance level (see Fig. 3).
Spectral shape of P2 in 10-80 GeV range
Although a very good agreement is found between the power-law indices derived for the Fermi-LAT data and for H.E.S.S. II above 10 GeV (see below), the power law is not the favoured model for the spectrum of P2 at these energies. Indeed, assuming a log-parabola model, a curvature at a significance level of 3.3σ is first measured with the LAT. This is further confirmed by the variation observed in the spectral index as a function of the analysis threshold energy (10 and 20 GeV) with both instruments, in a consistent manner: Δ10-20 GeV(ΓLAT)= +0.70 ± 0.31 and Δ10-20 GeV(ΓHESS)= +0.90 ± 0.30. This is further supported by weak evidence of an emission above 100 GeV obtained with CT5. The signal from P2 detected by H.E.S.S. II consists therefore of the same spectral component as that of the Fermi-LAT data above 100 MeV. This thereby confirms its sub-exponential cut-off form (see Fig. 4).
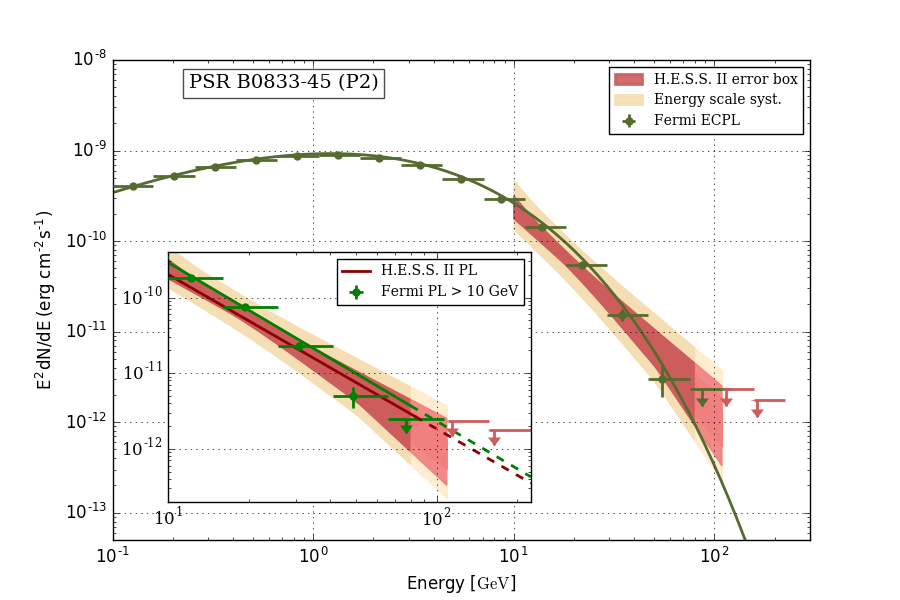
Relative energy scale offset between Fermi-LAT and H.E.S.S. II
When assuming a power-law model for the spectrum of the P2 pulse above 10 GeV, an excellent agreement was found for the photon indices (Γ=4.1) obtained from CT5 and the Fermi-LAT data (see the inset in Fig. 4). A deviation in flux, Φ0HESS/Φ0LAT = 0.76 ± 0.06 (stat) ± 0.21 (sys), was however found. Although the ratio of the fluxes is compatible with unity within the estimated errors, systematic effects due to a difference in absolute energy scales or those that can bias the effective area (e.g. the uncertainties on event reconstruction and/or selection efficiencies) are not excluded. If the effect is assumed to be only due to a difference in absolute energy scales, a relative offset of less than 8% is inferred between the two instruments. This value is well contained within the uncertainty range of ±10% usually quoted for IACTs (e.g. [19][20]). Additionally, the systematic error estimated for the absolute scale of the Fermi-LAT, +2%/-5% [21], should be taken into account.
Conclusions
The Vela pulsar is the second pulsar ever detected from ground in gamma-rays, after the Crab pulsar [22][15][16]. The knowledge of its pulsed gamma-ray spectrum in the 1-20 GeV range, thanks to data obtained from space-borne instruments, specially the Fermi-LAT, makes this pulsar a formidable calibration source for low-energy threshold ground-based gamma-ray telescopes operating in the Southern hemisphere. Using the Vela pulsar in this manner, the largest dish of the H.E.S.S. II array, CT5, has been successfully commissioned down to energies as low as ~10 GeV, which is unprecedented in ground-based gamma-ray astronomy.
Beyond the validation of the instrument, the measurements made with H.E.S.S. II in the 10-100 GeV range, combined with those of the Fermi-LAT, have brought additional pieces of information on gamma-ray emission from the Vela pulsar, e.g. the extreme sharpening of the trailing edge of its P2 pulse beyond 20 GeV, and the confirmation of the curvature of its spectrum in the <100 GeV range. This is at variance with the Crab pulsar, of which the emission is detected continuously from energies of tens of GeV up to ~1 TeV [23].
References:
[1] Large, Vaughan and Mills, 1968, Nature, 220, 340-341
[2] Hewish, A., Bell, S. J., et al., 1968, Nature, 217, 709-713
[3] P. Albats et al., 1974, Nature, 251, 400
[4] Thompson, D. J., Fichtel, C. E., Kniffen, D. A., & Ogelman, H. B., 1975, ApJ, 200, L79
[5] Kanbach, G., Bennett, K., Bignami, G. F., et al., 1980, A&A, 90, 163
[6] Kanbach, G., Arzoumanian, Z., Bertsch, D. L., et al., 1994, A&A, 289, 855
[7] Pellizzoni, A., Pilia, M., Possenti, A., et al., 2009, ApJ, 691, 1618
[8] Abdo, A. A., Ackermann, M., Atwood, W. B., et al., 2009, ApJ, 696, 1084
[9] Aharonian, F., Akhperjanian, A. G., Bazer-Bachi, A. R., et al., 2007, A&A, 466, 543
[10] Abdo, A. A., Ackermann, M., Ajello, M., et al., 2010, ApJ, 713, 154
[11] Leung, G. C. K., Takata, J., Ng, C. W., et al., 2014, ApJ, 797, L13
[12] Djannati-Atai, A., Giavitto, G., Holler, M., Rudak, B., Venter, C. for the H.E.S.S. Collaboration, 2016, AIP Conf. Proc., 1792, pp.040028, 2017
[13] H.E.S.S. Collaboration, H. Abdalla et al., and M. Kerr, S. Johnston, R.M. Shannon, accepted for publication in A&A
[14] Abdo, A. A., Ackermann, M., Ajello, M., et al., 2010, ApJ, 708, 1254
[15] VERITAS Collaboration, Aliu, E., Arlen, T., et al., 2011, Science, 334, 69
[16] Aleksic, J., Alvarez, E. A., Antonelli, L. A., et al., 2012, A&A, 540, A69
[17] Arka, I. & Dubus, G., 2013, A&A, 550, A101
[18] Mochol, I. & Pétri, J., 2015, MNRAS, 449, L51
[19] Aharonian, F., Akhperjanian, A. G., Bazer-Bachi, A. R., et al. 2006, A&A, 457, 899
[20] Meyer, M., Horns, D., Zechlin, H.-S., 2010, A&A, 523, A2
[21] Ackermann, M., Ajello, M., Albert, A., et al., 2012, ApJS, 203, 4
[22] E. Aliu et al., 2008, Science 322, 1221
[23] Ansoldi, S., Antonelli, L. A., Antoranz, P., et al., 2016, A&A, 585, A133