The central region of the Milky Way is one of the foremost locations to look for dark matter (DM) signatures. We report the first results on a search for DM particle annihilation signals using new observations from an unprecedented γ -ray survey of the Galactic Center (GC) region, i.e., the Inner Galaxy Survey, at very high energies (≳100 GeV ) performed with the H.E.S.S. array of five ground-based Cherenkov telescopes. No significant γ -ray excess is found in the search region of the 2014-2020 dataset and a profile likelihood ratio analysis is carried out to set exclusion limits on the annihilation cross section ⟨σ v ⟩. Assuming Einasto and Navarro-Frenk-White (NFW) DM density profiles at the GC, these constraints are the strongest obtained so far in the TeV DM mass range. For the Einasto profile, the constraints reach ⟨σ v ⟩ values of 3.7 ×10⁻²⁶ cm3 s-1 for 1.5 TeV DM mass in the W+W– annihilation channel, and 1.2 ×10⁻²⁶ cm3 s-1 for 0.7 TeV DM mass in the τ+τ– annihilation channel. With the H.E.S.S. Inner Galaxy Survey, ground-based γ -ray observations thus probe ⟨σ v ⟩ values expected from thermal-relic annihilating TeV DM particles.

Figure 1:
Constraints on the velocity-weighted annihilation cross-section for the W+W- [DAT] (left panel) and tau+tau- [DAT] (right panel) channels derived from H.E.S.S. observations:
 |
 |
| LimitsWW.pdf | Limitstautau.pdf |
Figure 2: Constraints on the velocity-weighted annihilation cross-section for the W+W-, comparing the impact of the DM density distribution on the constraints (left panel) and the results obtained with other instruments (right panel): limits for Einasto 2 [DAT] and for NFW [DAT]
/ the limits for the other instruments have been extracted from the corresponding papers.
 |
 |
| LimitsProfiles.pdf | LimitsSummary.pdf |
Table 1 (Supplemental Material): Pointing positions in Galactic coordinates for the 2016-2020 IGS observations. The first column gives the names of the pointing positions, which were chosen sequentially during the years. The second and third columns give the Galactic longitudes and latitudes of the pointing positions.
| Pointing position name | Gal. long. [deg] | Gal. lat. [deg] |
|---|---|---|
| 1-4 | -3.0 | 0.8 |
| 1-5 | -1.8 | 0.8 |
| 1-6 | -0.6 | 0.8 |
| 1-7 | 0.6 | 0.8 |
| 1-8 | 1.8 | 0.8 |
| 1-9 | 3.0 | 0.8 |
| 2-5 | -1.8 | 2.0 |
| 2-6 | -0.6 | 2.0 |
| 2-7 | 0.6 | 2.0 |
| 2-8 | 1.8 | 2.0 |
| 3-5 | -1.8 | 3.2 |
| 3-6 | -0.6 | 3.2 |
| 3-7 | 0.6 | 3.2 |
| 3-8 | 1.8 | 3.2 |
Figure 1 (Supplemental Material): Exposure maps (in m2s), in Galactic coordinates, from H.E.S.S. observations of the Galactic Center region:
top left panel [ROOT],
top right panel [ROOT],
bottom left panel [ROOT],
bottom right panel [ROOT],

|
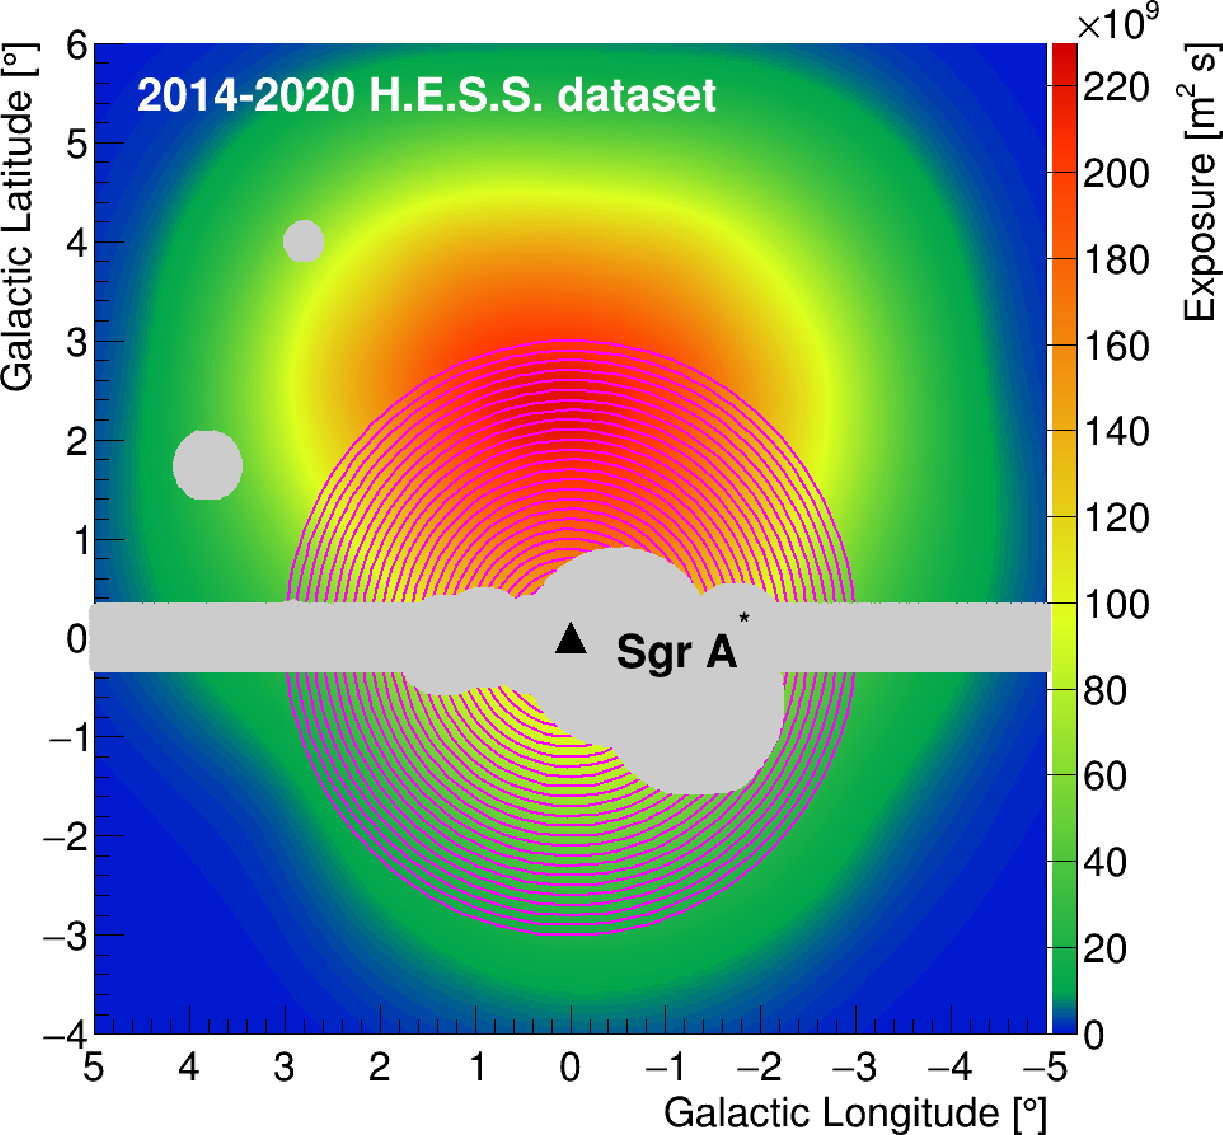
|
| Exposure_m2s_2014_2020_IGSpp.pdf | Exposure_m2s_2014_2020_masksRoI.pdf |
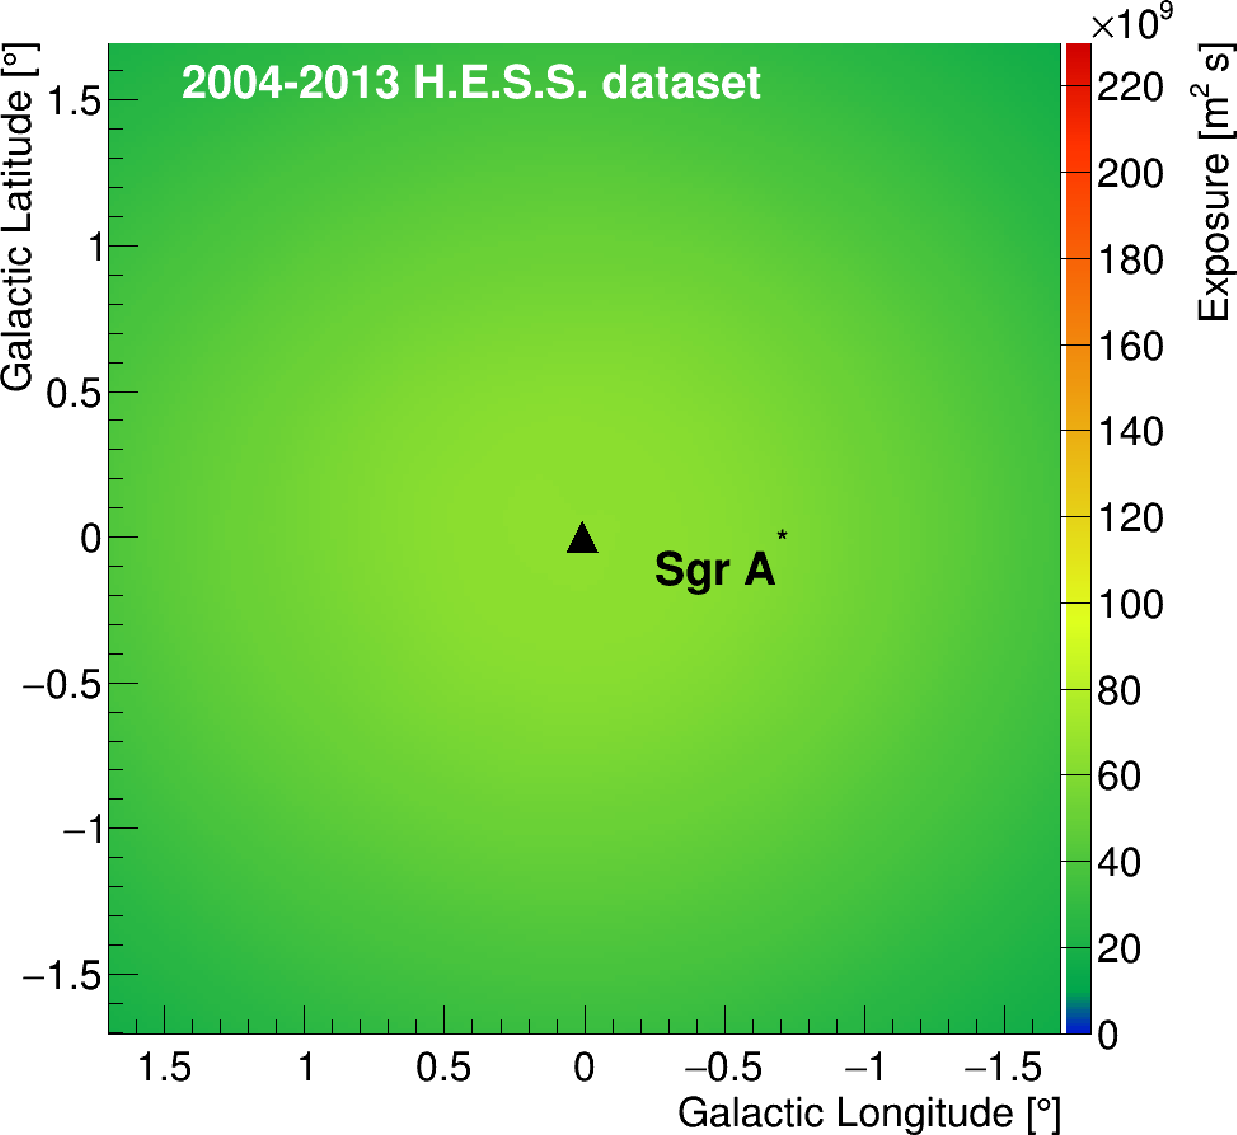
|
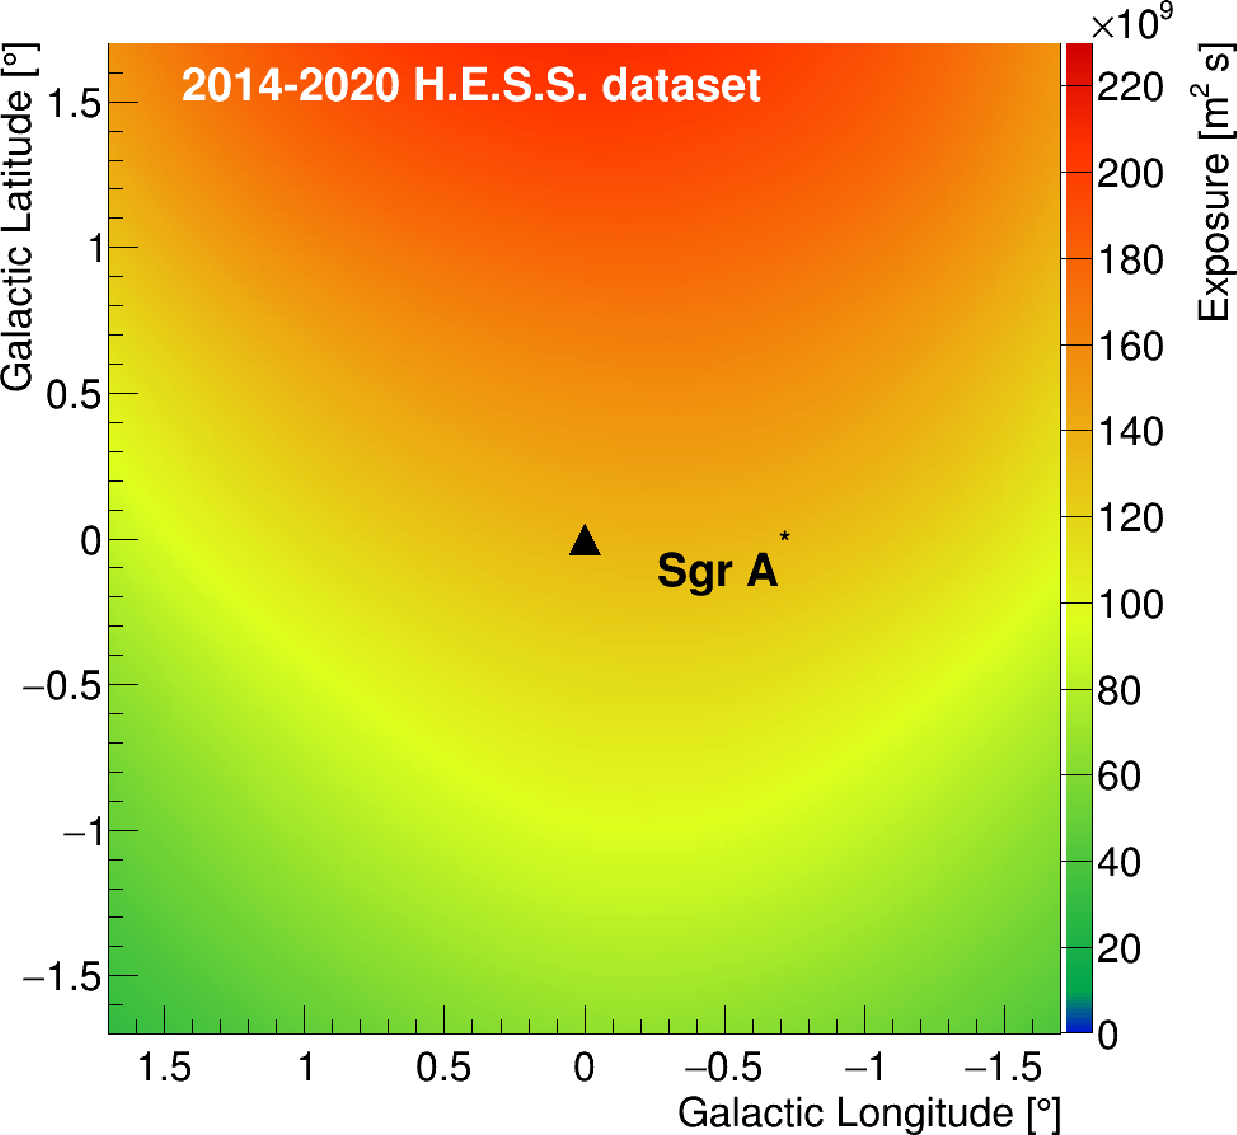
|
| Exposure_m2s_2004_2013_zoom.pdf | Exposure_m2s_2014_2020_zoom.pdf |
Table 2 (Supplemental Material): Parameters of the cuspy profiles, Einasto, Einasto2 and NFW, used for the DM distribution.
| Profiles | Einasto | NFW | Einasto 2 |
|---|---|---|---|
| rho_s (GeV/cm3) | 0.079 | 0.307 | 0.033 |
| r_s (kpc) | 20.0 | 21.0 | 28.4 |
| alpha_s | 0.17 | / | 0.17 |
Figure 2 (Supplemental Material): Dark matter density profiles versus distance from the Galactic Center for the profiles used in this work (parameters and equations for the profiles are provided in the paper):

Table 3 (Supplemental Material): J-factor values in units of GeV2/cm5, for the 25 ROIs in this work. The first four columns give the ROI number, the inner radius, the outer radius, and the size in solid angle for each RoI. The fifth column provides the total J-factor values in the ROI, computed without applying the masks on the excluded regions, for the Einasto profile considered in this work together with the values obtained for an NFW profile and an alternative normalization of the Einasto profile in sixth and seventh columns, respectively.
| ith ROI | Inner radius [deg.] | Outer radius [deg.] | Solid angle DeltaOmega [1e-4 sr] | J-factor Einasto [1e20 GeV2/cm5] | J-factor NFW [1e20 GeV2/cm5] | J-factor Einasto2 [1e20 GeV2/cm5] |
|---|---|---|---|---|---|---|
| 1 | 0.5 | 0.6 | 1.05 | 9.5 | 4.9 | 3.0 |
| 2 | 0.6 | 0.7 | 1.24 | 9.8 | 4.9 | 3.2 |
| 3 | 0.7 | 0.8 | 1.44 | 10.1 | 4.9 | 3.3 |
| 4 | 0.8 | 0.9 | 1.63 | 10.2 | 4.8 | 3.4 |
| 5 | 0.9 | 1.0 | 1.82 | 10.3 | 4.8 | 3.5 |
| 6 | 1.0 | 1.1 | 2.01 | 10.4 | 4.8 | 3.5 |
| 7 | 1.1 | 1.2 | 2.20 | 10.5 | 4.7 | 3.6 |
| 8 | 1.2 | 1.3 | 2.39 | 10.5 | 4.7 | 3.6 |
| 9 | 1.3 | 1.4 | 2.58 | 10.5 | 4.7 | 3.6 |
| 10 | 1.4 | 1.5 | 2.77 | 10.5 | 4.6 | 3.7 |
| 11 | 1.5 | 1.6 | 2.97 | 10.4 | 4.6 | 3.7 |
| 12 | 1.6 | 1.7 | 3.16 | 10.4 | 4.6 | 3.7 |
| 13 | 1.7 | 1.8 | 3.35 | 10.3 | 4.5 | 3.7 |
| 14 | 1.8 | 1.9 | 3.54 | 10.3 | 4.5 | 3.7 |
| 15 | 1.9 | 2.0 | 3.73 | 10.2 | 4.5 | 3.7 |
| 16 | 2.0 | 2.1 | 3.92 | 10.2 | 4.5 | 3.7 |
| 17 | 2.1 | 2.2 | 4.11 | 10.1 | 4.4 | 3.7 |
| 18 | 2.2 | 2.3 | 4.31 | 10.0 | 4.4 | 3.7 |
| 19 | 2.3 | 2.4 | 4.50 | 9.9 | 4.4 | 3.7 |
| 20 | 2.4 | 2.5 | 4.69 | 9.9 | 4.3 | 3.6 |
| 21 | 2.5 | 2.6 | 4.88 | 9.8 | 4.3 | 3.6 |
| 22 | 2.6 | 2.7 | 5.07 | 9.7 | 4.3 | 3.6 |
| 23 | 2.7 | 2.8 | 5.26 | 9.6 | 4.3 | 3.6 |
| 24 | 2.8 | 2.9 | 5.45 | 9.5 | 4.3 | 3.6 |
| 25 | 2.9 | 3.0 | 5.64 | 9.5 | 4.2 | 3.6 |
Table 4 (Supplemental Material): Photon statistics in the ON and OFF regions, respectively, together with the corresponding excess significance in each of the 25 ROIs considered in this work. The first row gives the ROI number. The second and third columns give the photon statistics in the ON and OFF regions, respectively. The fourth row gives the excess significance.
| ith ROI | NON | NOFF | S(sigma) |
|---|---|---|---|
| 1 | 326 | 298 | 1.1 |
| 2 | 1830 | 1674 | 2.6 |
| 3 | 3029 | 3087 | -0.7 |
| 4 | 4736 | 4665 | 0.7 |
| 5 | 6793 | 6699 | 0.8 |
| 6 | 9144 | 9164 | -0.2 |
| 7 | 12036 | 11899 | 0.9 |
| 8 | 15201 | 15177 | 0.1 |
| 9 | 16830 | 17242 | -2.2 |
| 10 | 19530 | 19721 | -0.9 |
| 11 | 23549 | 23270 | 1.3 |
| 12 | 25585 | 25568 | 0.1 |
| 13 | 27571 | 27673 | -0.4 |
| 14 | 29875 | 29945 | -0.3 |
| 15 | 32328 | 32518 | -0.8 |
| 16 | 35094 | 34774 | 1.2 |
| 17 | 37292 | 37502 | -0.8 |
| 18 | 39957 | 40159 | -0.7 |
| 19 | 42540 | 42775 | -0.8 |
| 20 | 42460 | 42939 | -1.6 |
| 21 | 42282 | 42415 | -0.5 |
| 22 | 42317 | 42509 | -0.7 |
| 23 | 42653 | 42896 | -0.8 |
| 24 | 43188 | 43011 | 0.6 |
| 25 | 42879 | 43373 | -1.7 |
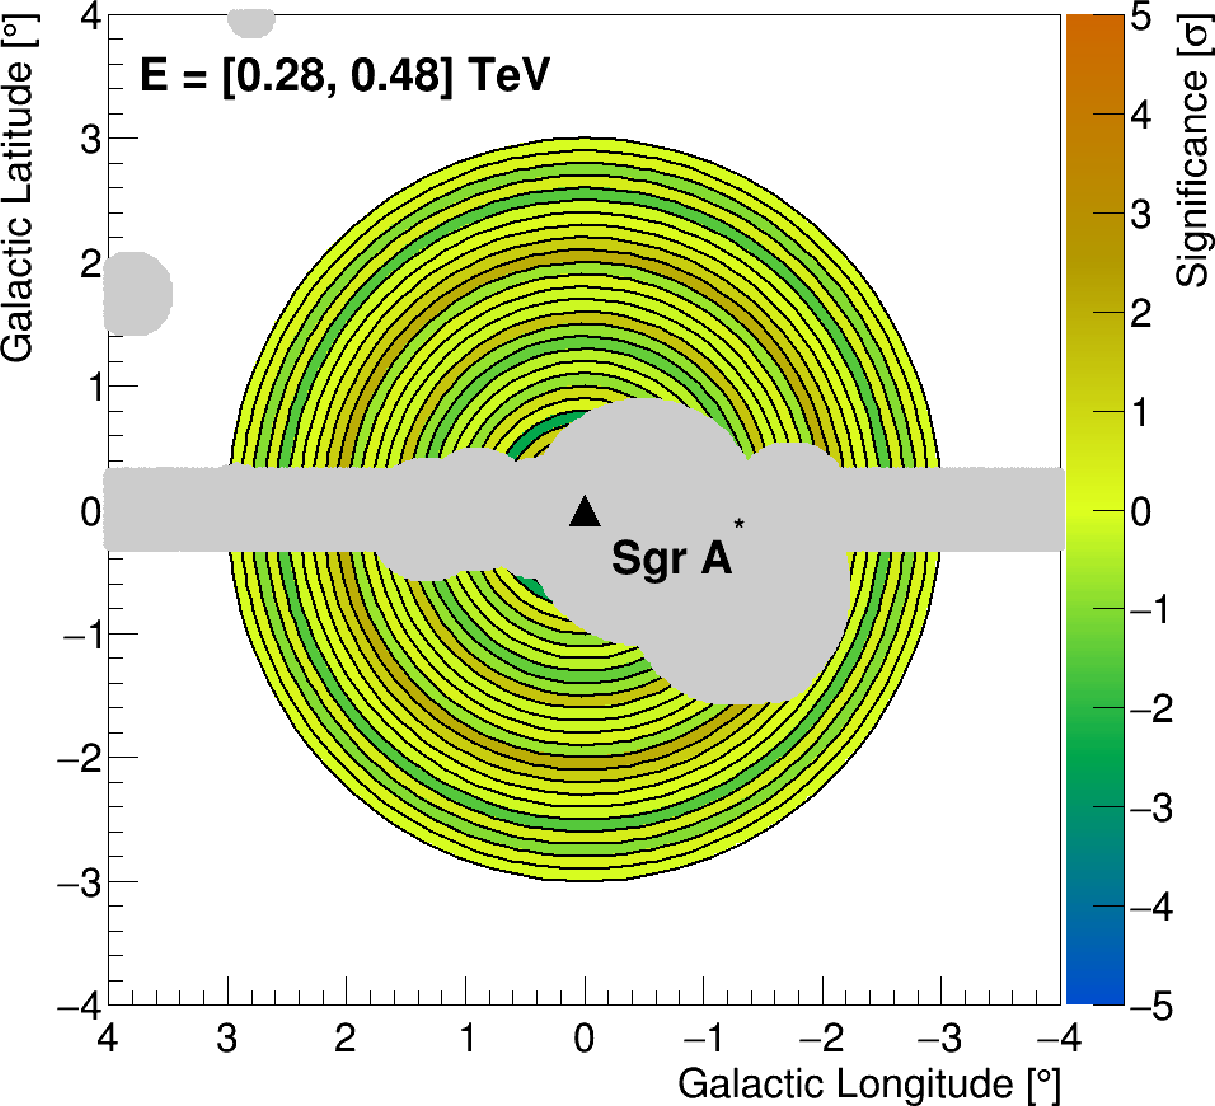
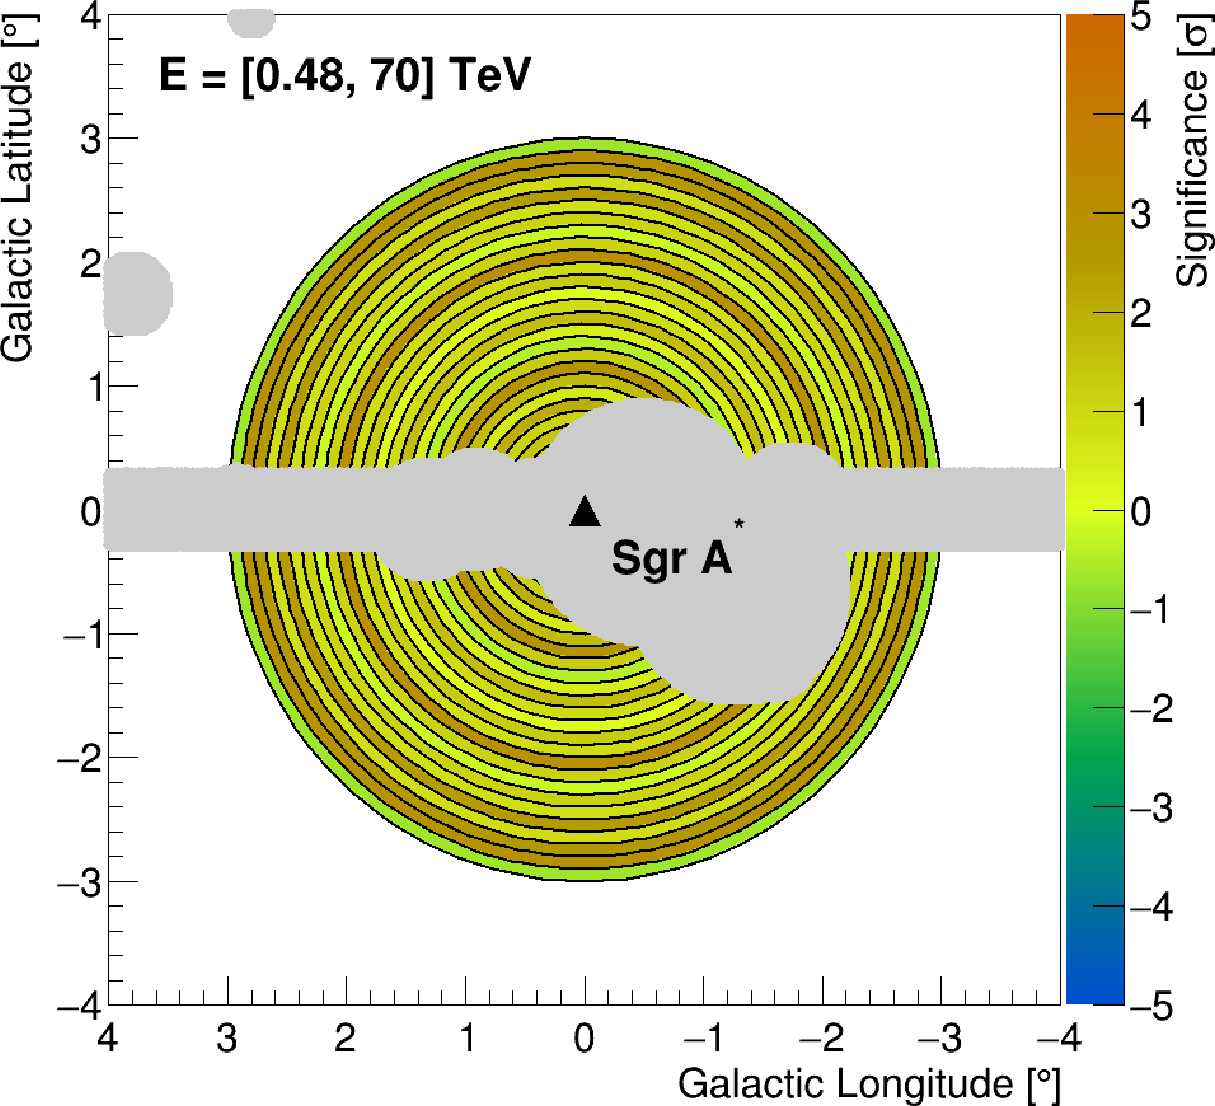
Figure 3 (Supplemental Material): Significance map of the residuals in Galactic coordinates in three energy bands:
Significance values for the [0.20, 0.28] TeV energy band [DAT]
/ [0.28, 0.48] TeV energy band [DAT]
/ [0.48, 70] TeV energy band [DAT]
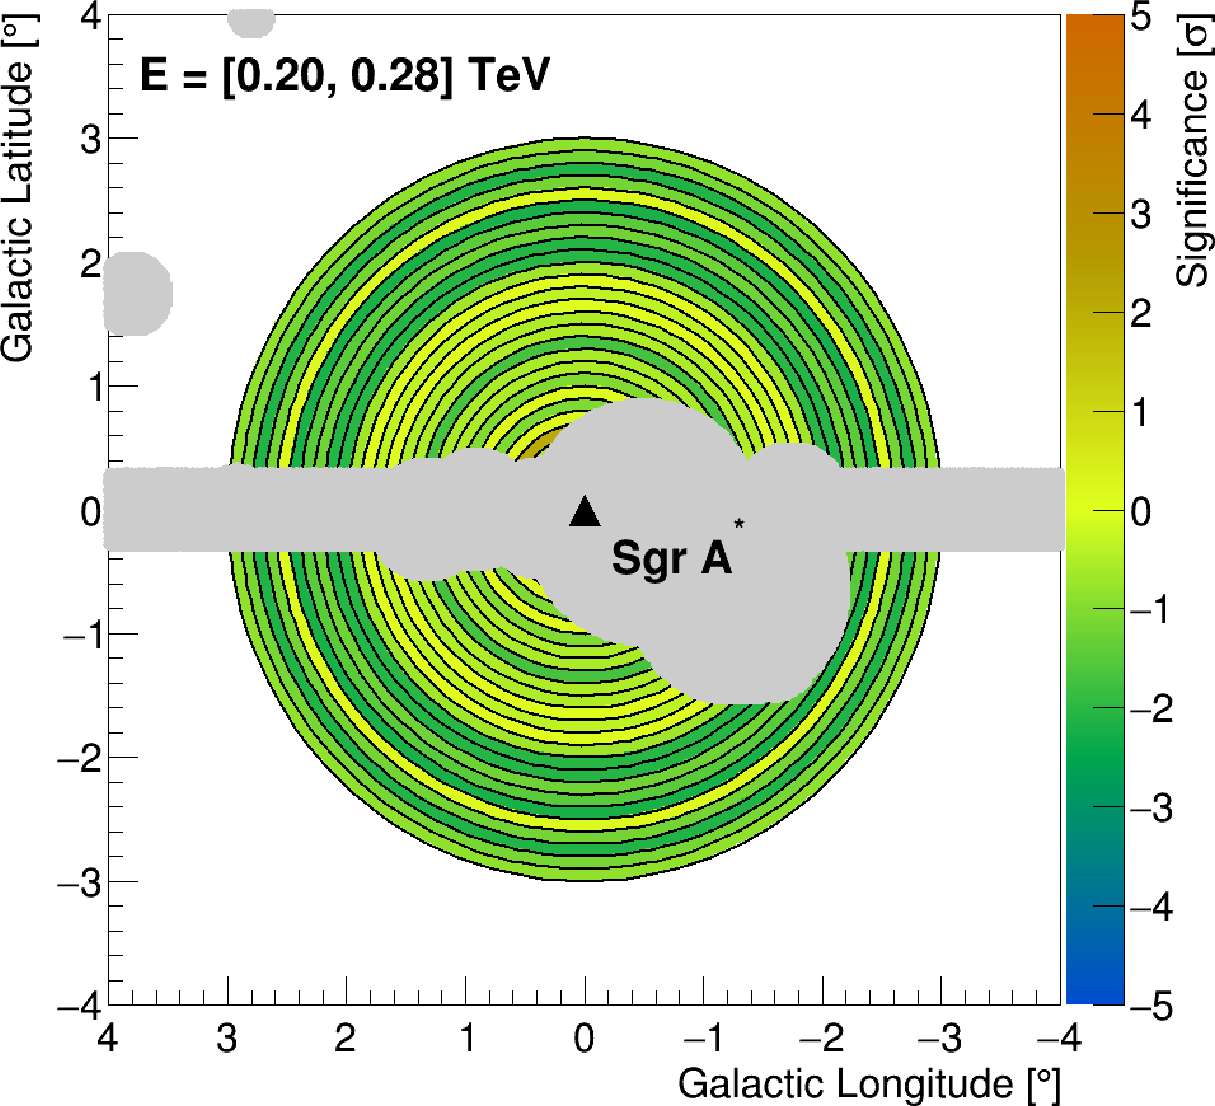
|
|
|
| SignificanceRoImap_IGS_masks_E1.pdf | SignificanceRoImap_IGS_masks_E2.pdf | SignificanceRoImap_IGS_masks_E3.pdf |
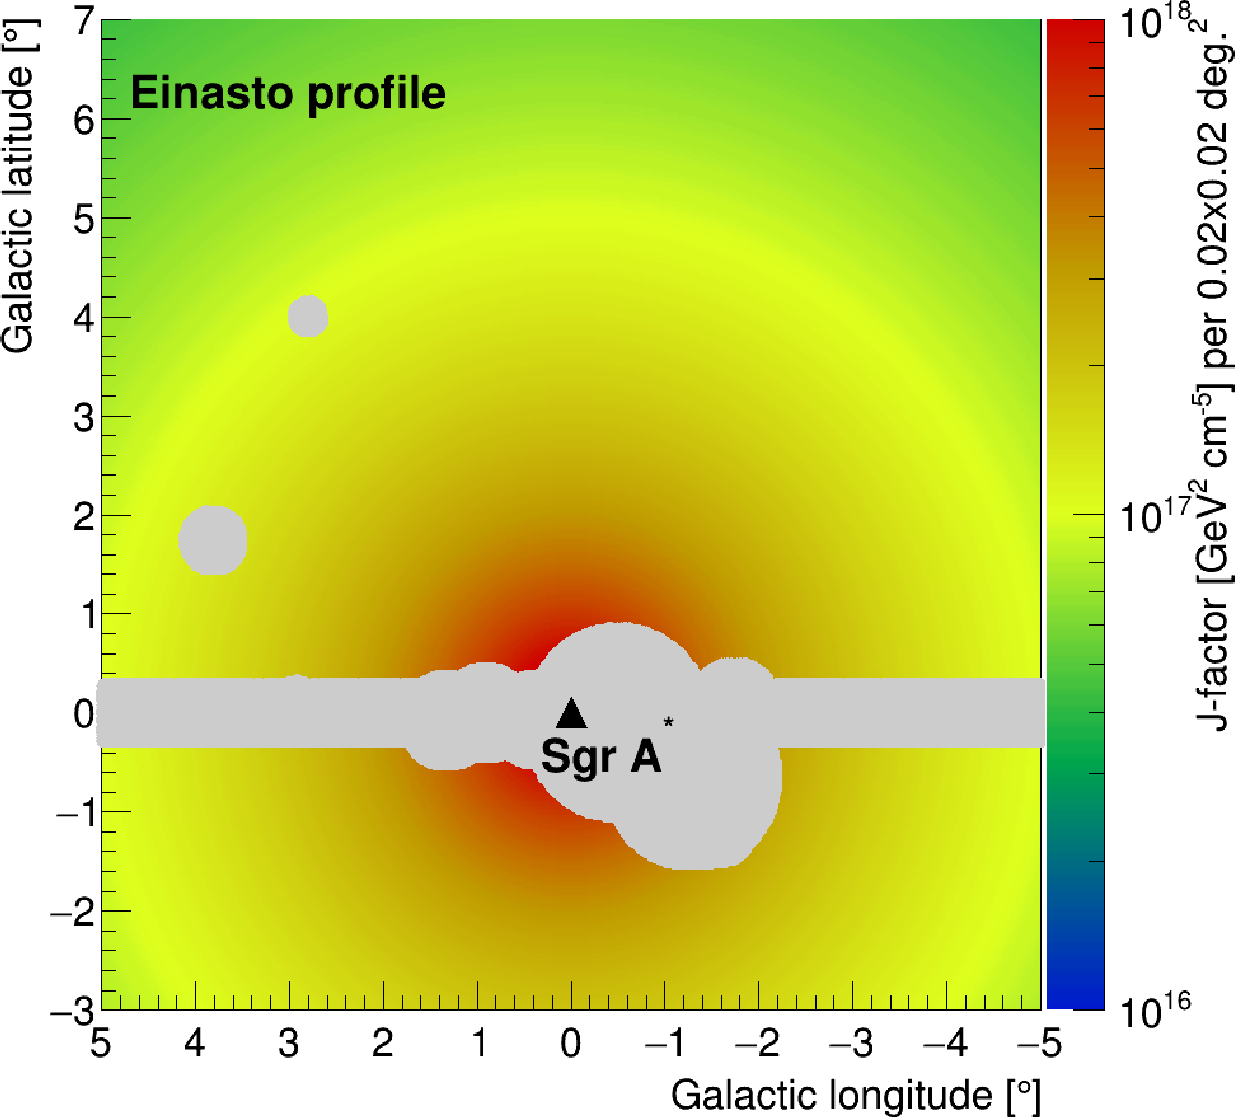
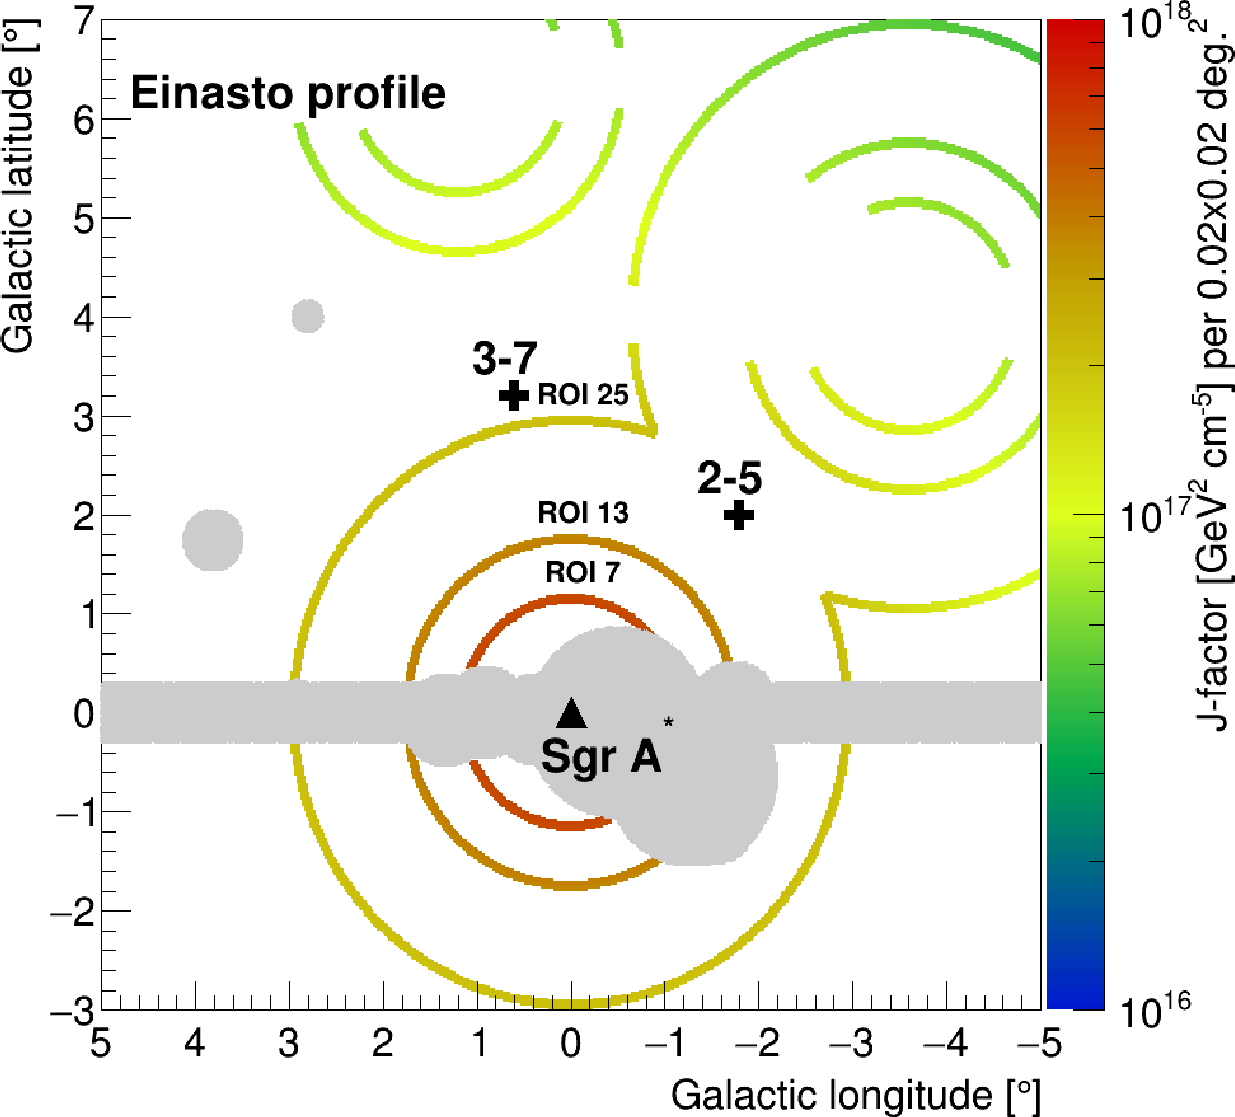
Figure 4 (Supplemental Material): J-factor maps for the Einasto profile in Galactic Coordinates (the parameters for the Einasto profile are provided in the paper). In the right panel, an example of the background determination method is shown:
|
|
| Jfac_profileE3_IGSregion_masks.pdf | Jfac_reflBkgr.pdf |
Figure 5 (Supplemental Material): Energy differential spectra expected for the self-annihilation of DM shown together with ON and OFF energy differential spectra, for 3 ROIs and the combination of all of them:
Spectra for ROI 16 (ON and OFF) [DAT] (DM) [DAT]
/ for ROI 17 (ON and OFF) [DAT] (DM) [DAT]
/ for ROI 18 (ON and OFF) [DAT] (DM) [DAT]
/ all ROIs (ON and OFF) [DAT] (DM) [DAT]

SpectraNONNOFFWW_RoI161718_panel.pdf
Figure 6 (Supplemental Material): Energy differential flux for ON and OFF region, for 3 ROIs and the combination of all of them:
Spectra for ROI 16 (ON and OFF) [DAT]
/ for ROI 17 (ON and OFF) [DAT]
/ for ROI 18 (ON and OFF) [DAT]
/ all ROIs (ON and OFF) [DAT]

Figure 7 (Supplemental Material): Background-subtracted energy-differential spectra for ON minus OFF region, for different combination of the ROIs:
Background-subtracted spectra for all the combination [DAT]
(there are 8 pairs of columns, each one correspond to the point and error per energy bin, considering the same energy bins for the previous figures)

ResidualSpectram_CombROI_panel.pdf
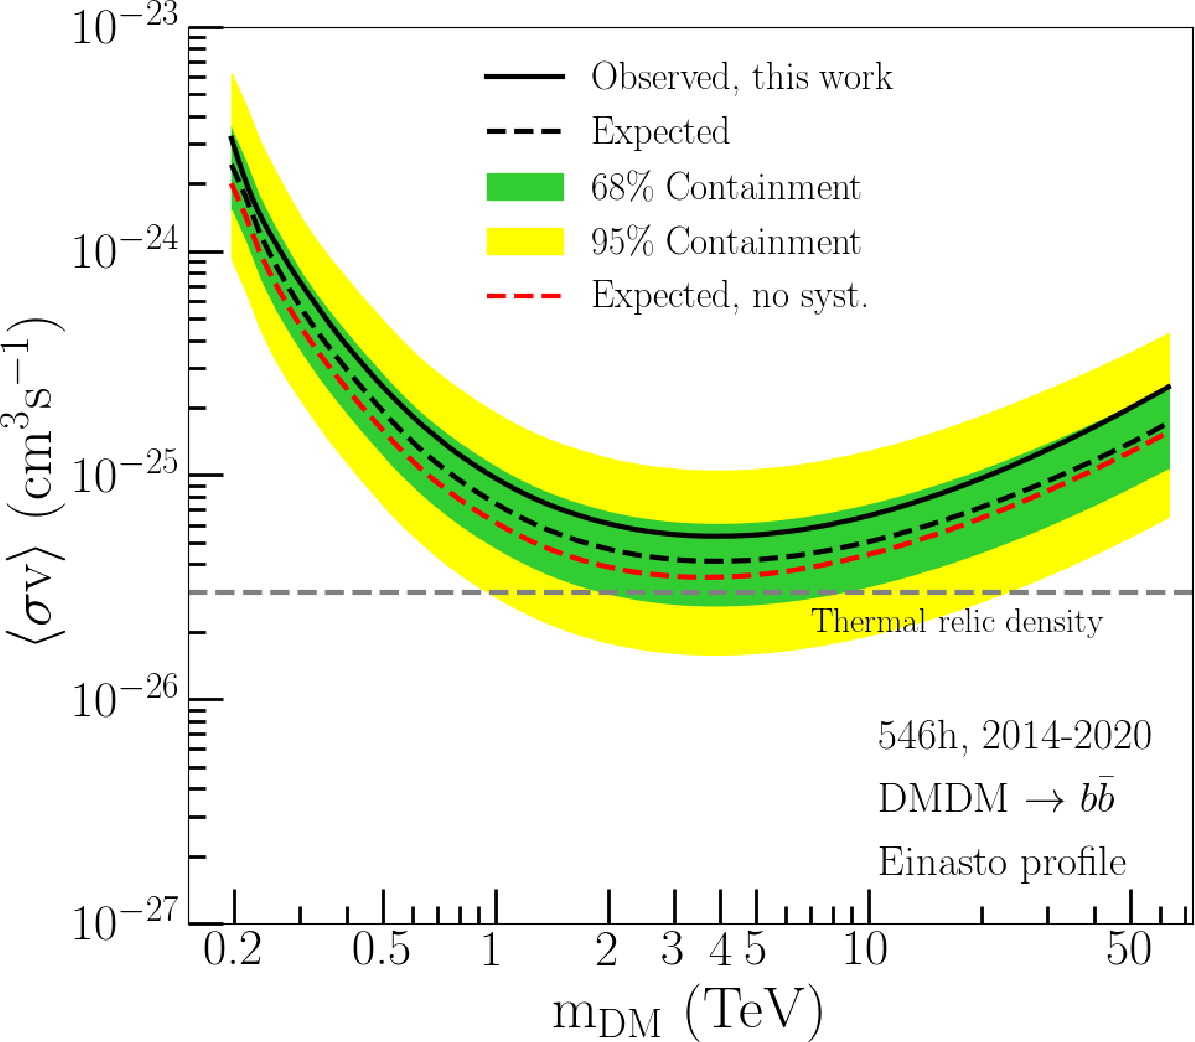
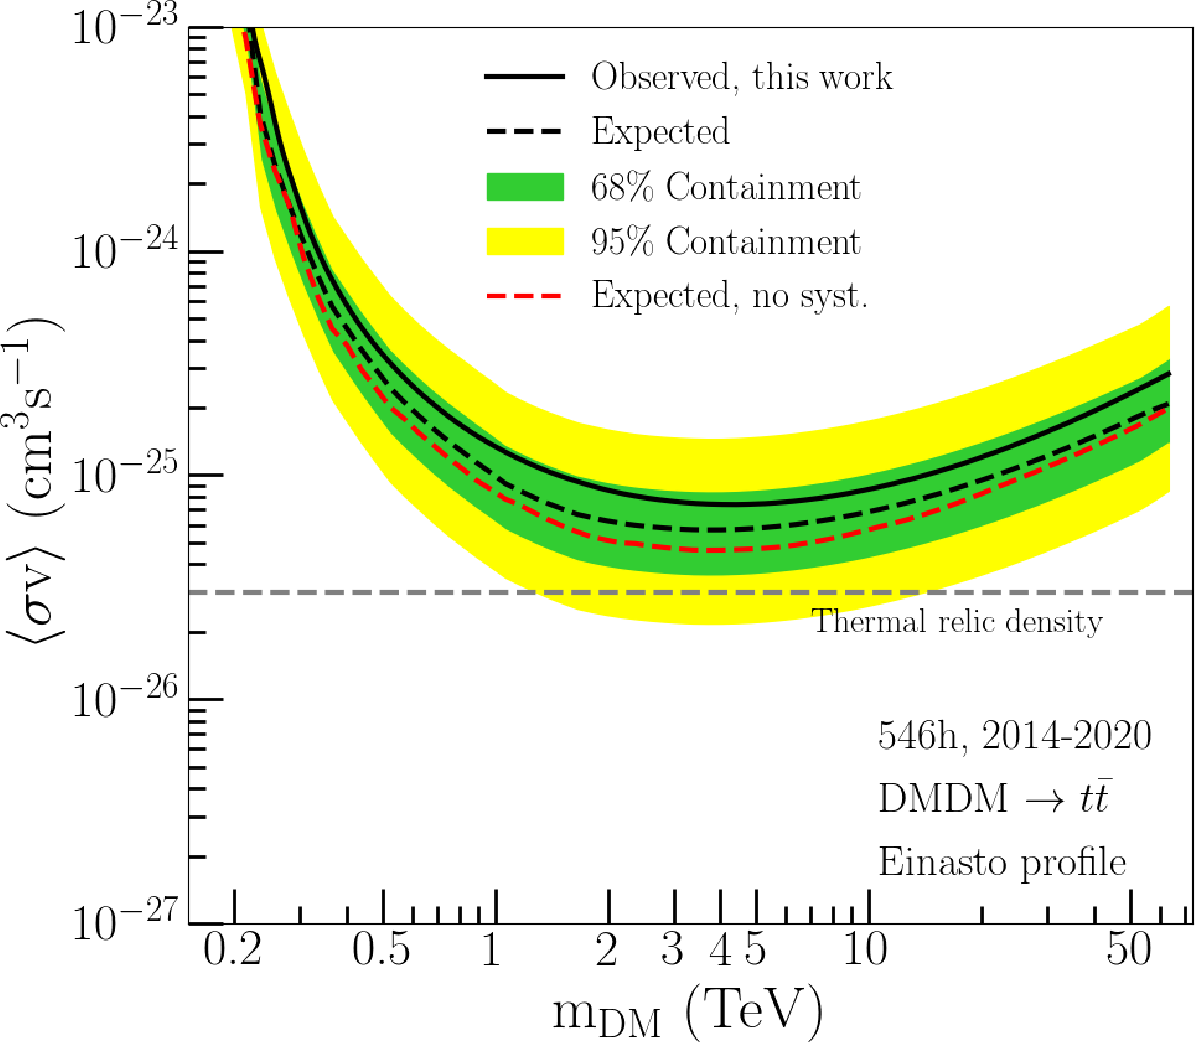
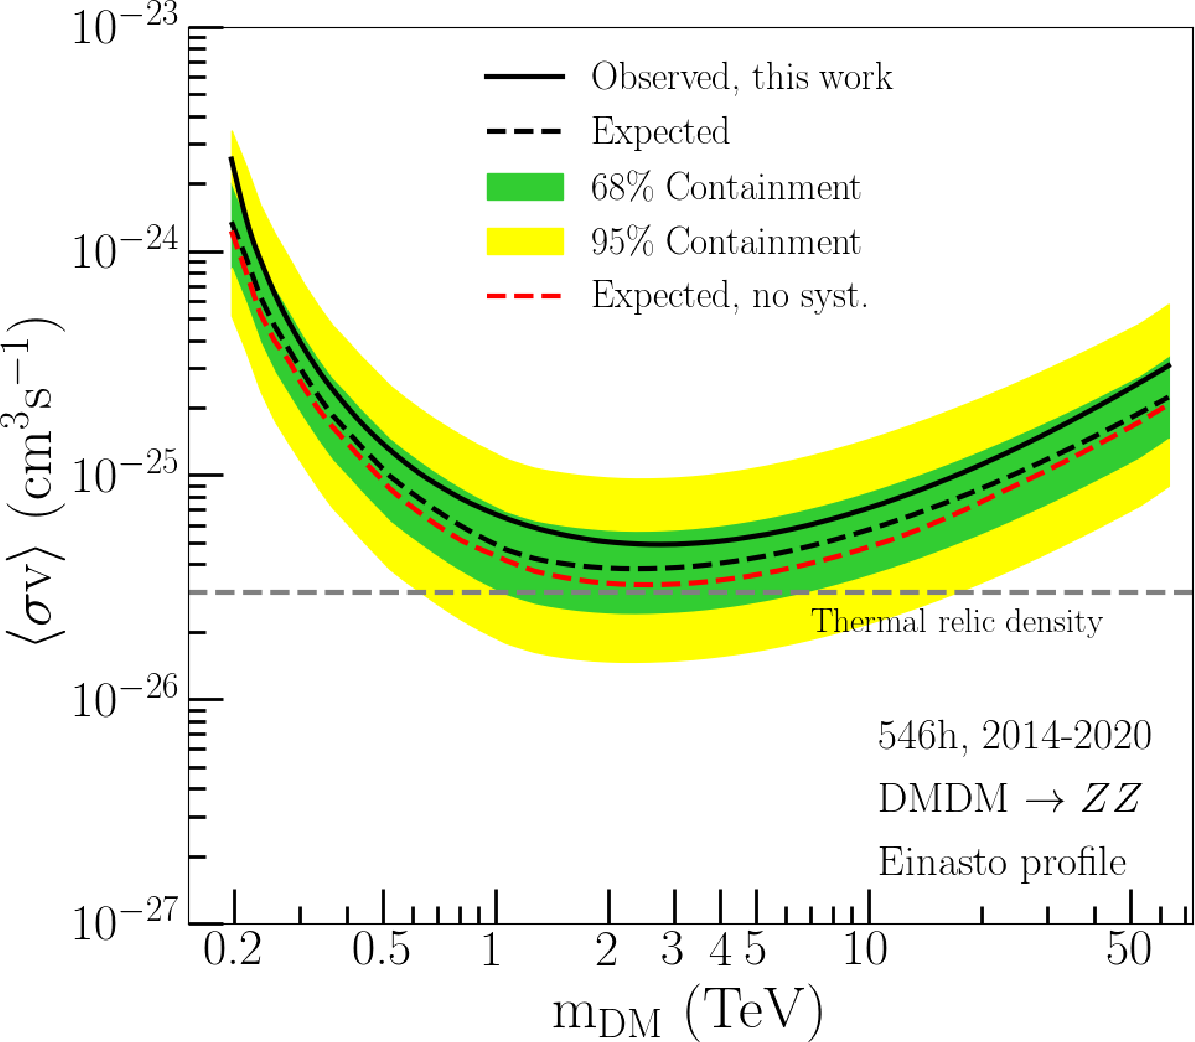
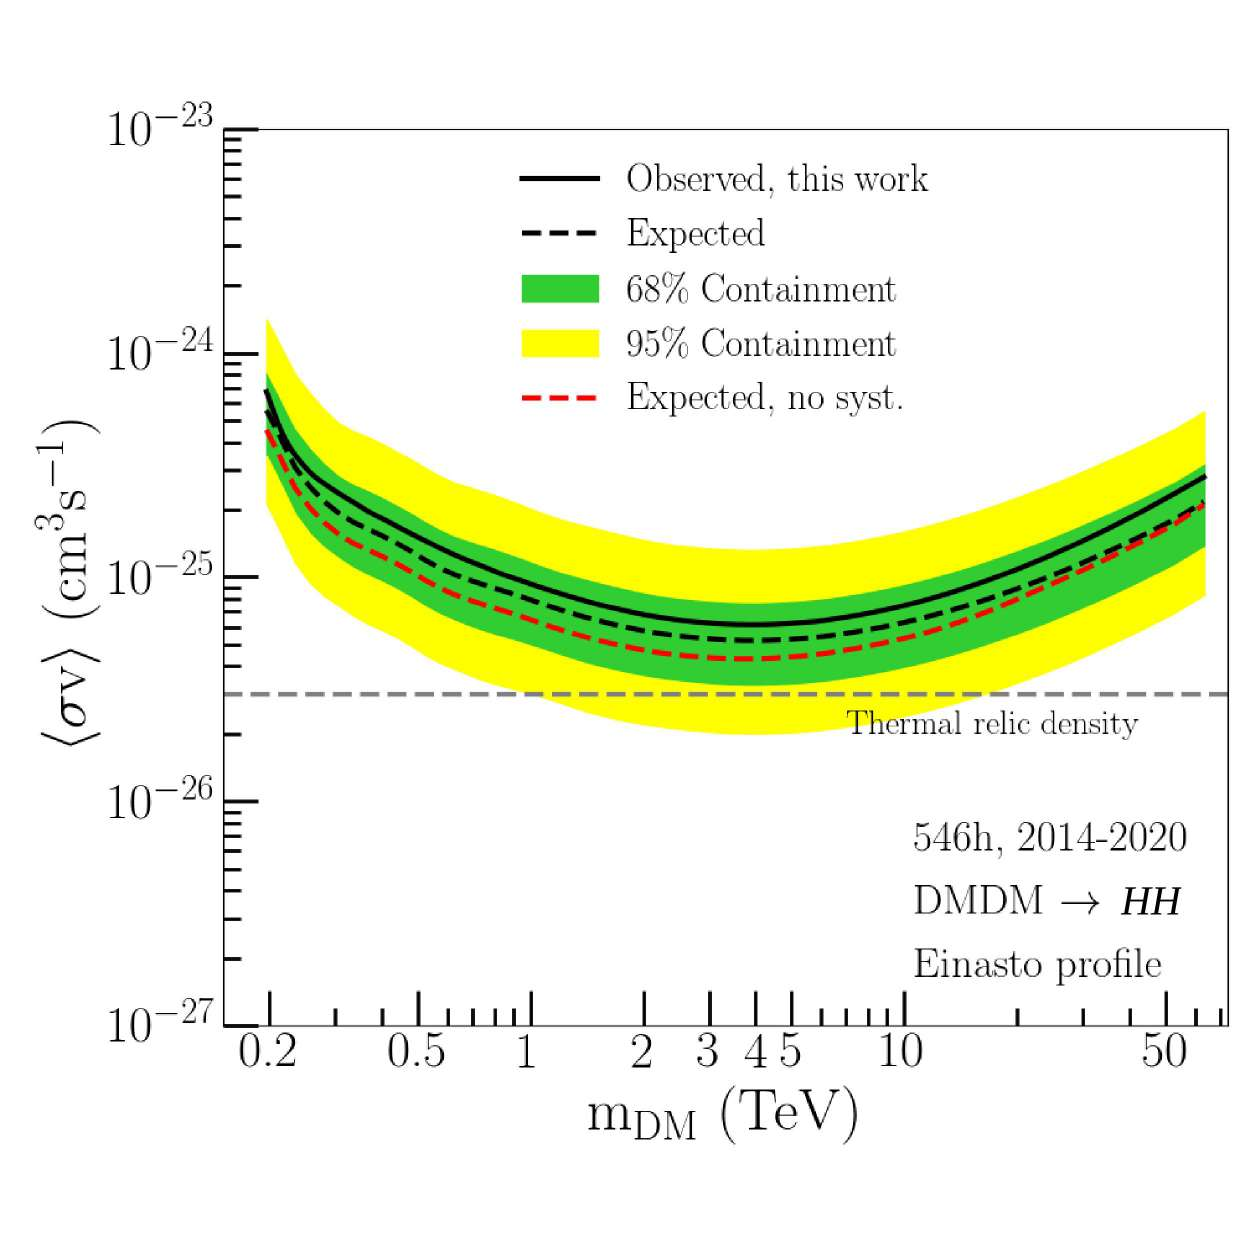
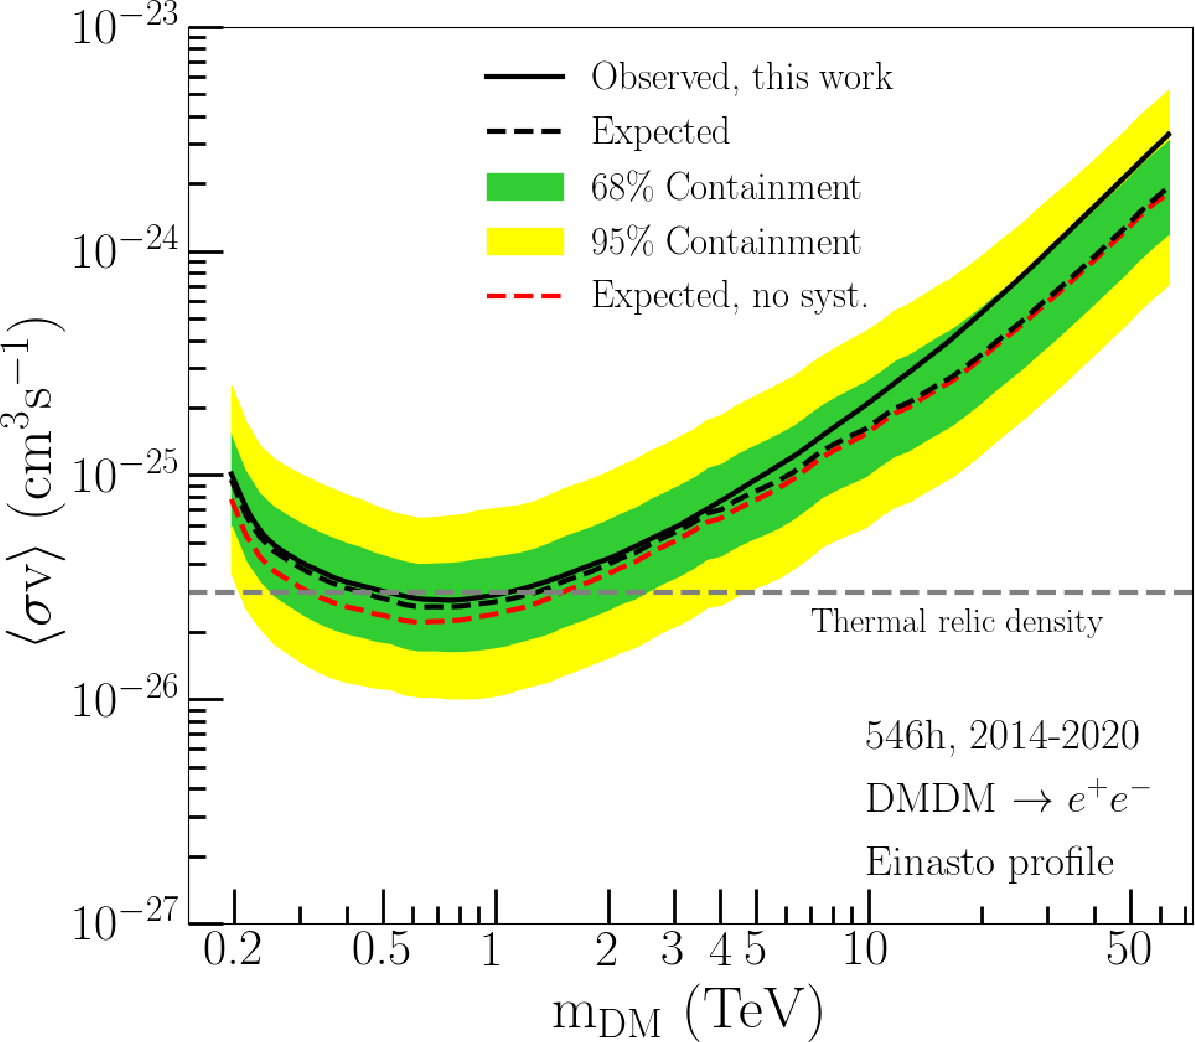
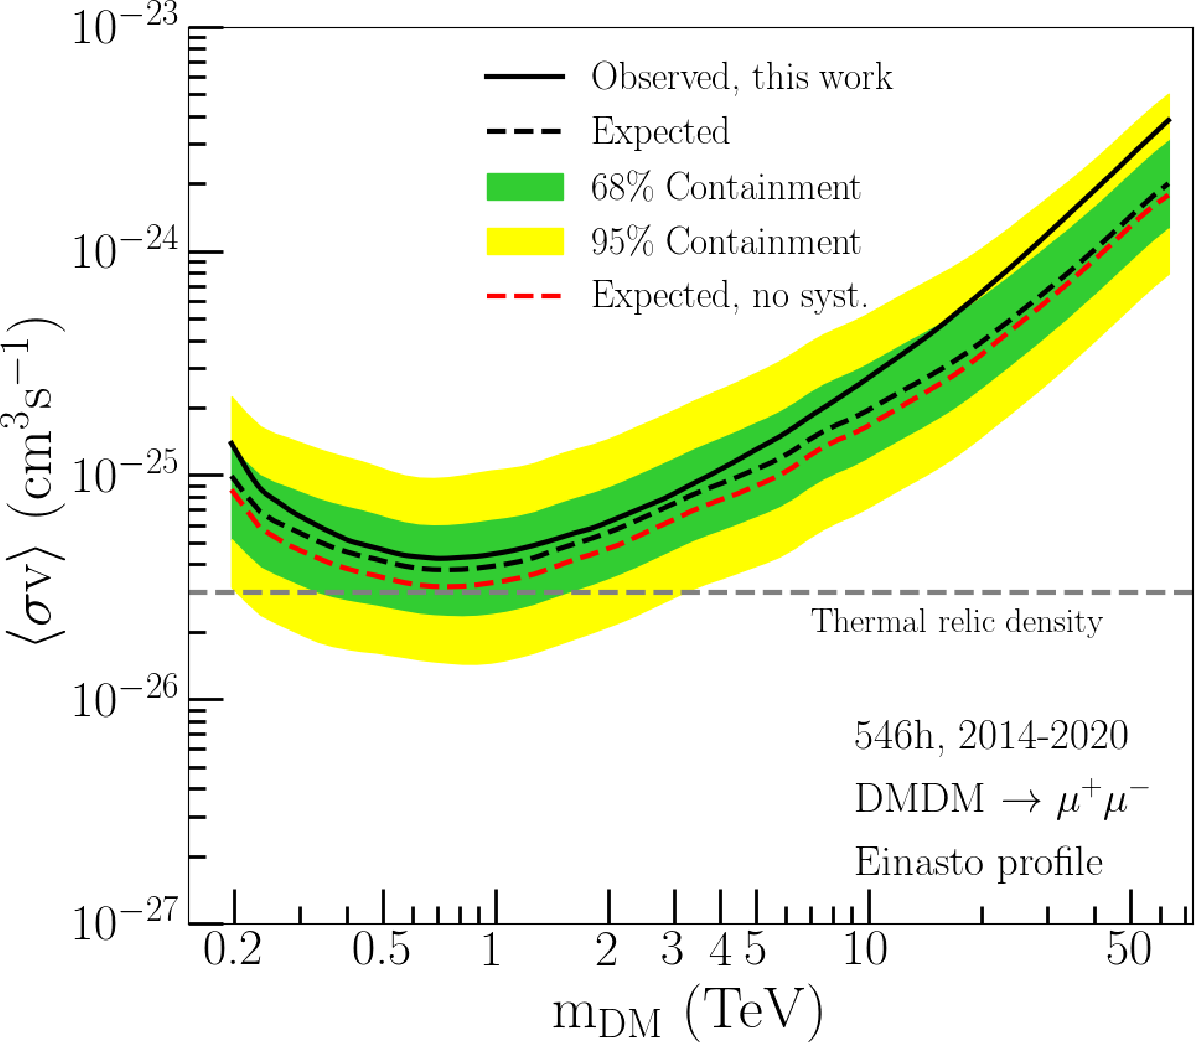
Figure 8 (Supplemental Material): Constraints on the velocity-weighted annihilation cross-section for the bb bar [DAT], tt bar [DAT],
ZZ [DAT], HH [DAT], e+e- [DAT] and mu+mu- [DAT] channels derived from H.E.S.S. observations:
|
|
| Limitsbbbar.pdf | Limitsttbar.pdf |
|
|
| LimitsZZ.pdf | Limitshh.pdf |
|
|
| Limitsee.pdf | Limitsmumu.pdf |
